Nike: Corrective Pullback Approaching Key Support Levels
Before you read the article below, I would like to let you know that we published new US single stocks report. For now its still free, so check it out.
Grega
Over the past months, We’ve discussed Nike’s technical setup extensively in both our website webinars and single-stock reports. At the time, I highlighted that the higher-degree downtrend was approaching an area of major, attractive support—a zone that could potentially mark the bottom of a large wave four retracement on higher TF charts.
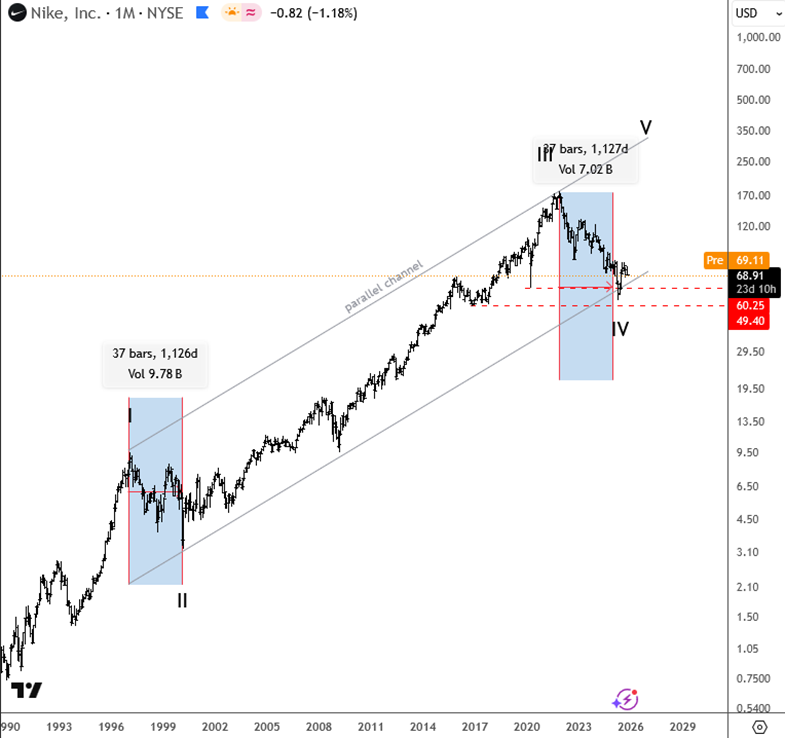
Deep, Time-Symmetrical Pullback
As you can see on the chart above, the current decline closely mirrors the 1997–2020 pullback in both length and depth, with the stock retracing roughly 70% from its highs. Despite this steep correction, consumer demand for Nike products remains robust, which creates an interesting divergence between price action and fundamentals.
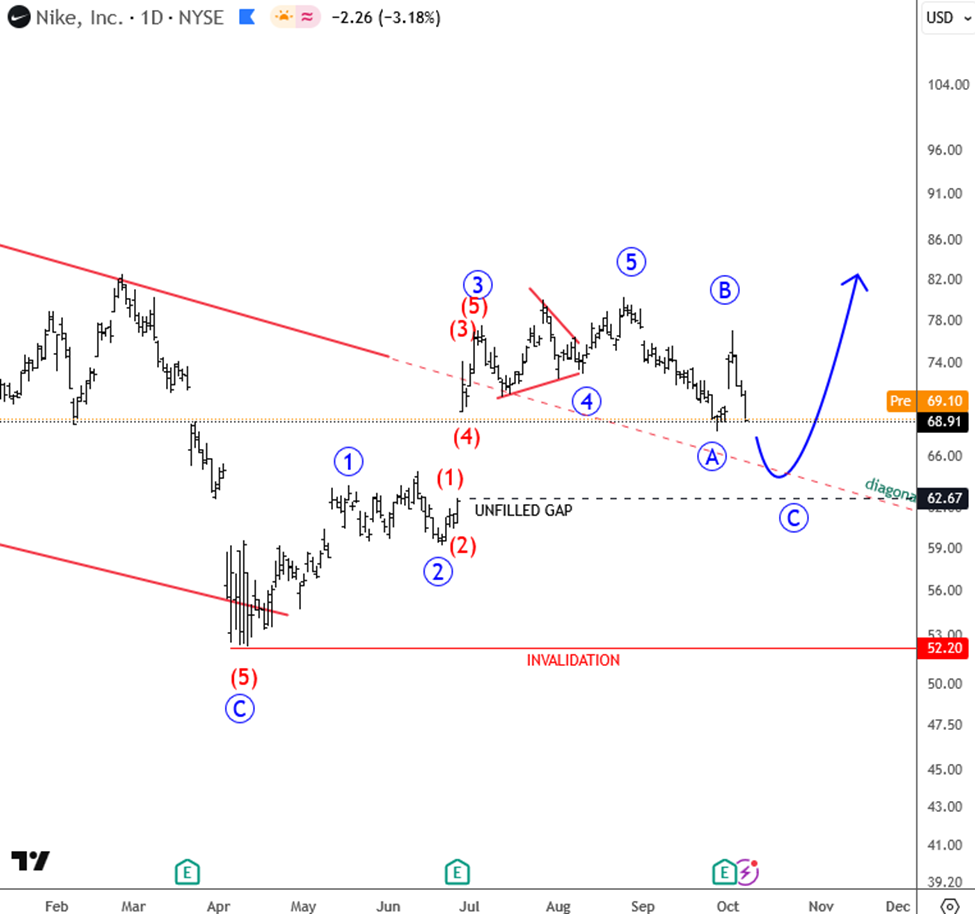
Technical Shifts Underway
Recently, the stock broke above a wedge trendline on impulsive price action, a strong early sign of a shift in momentum. The breakout zone has already been retested successfully, turning prior resistance into support. An August price gap is going to be filled it seems which could be ideal zone for a rebound after A-B-C legs.
The setup suggests potential for stabilization and a medium-term rebound from current support levels.