Chart of the Day - December Soymeal
The information and opinions expressed below are based on my analysis of price behavior and chart activity
Thursday, October 9, 2025
If you like this article and would like to receive more information on the commodity markets from Walsh Trading, please use the link to join our email list -Click here
Every morning, at about 8 AM CST, I post a short video highlighting where I see opportunities in the futures markets. You can view my most recent video here
December Soybean Meal (Daily)
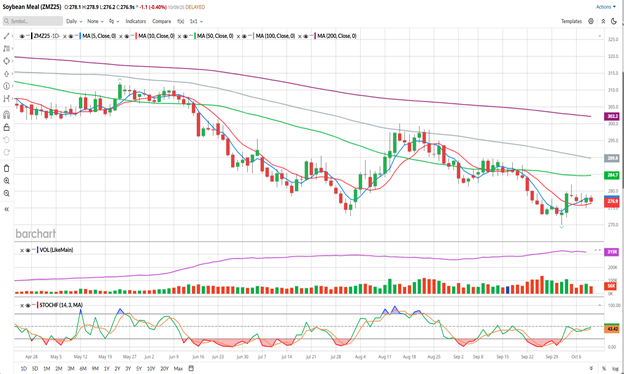
Today, December Soymeal settled at 276.90, down 1.10 on the day. At first glance of the chart above I see a market that is and has been in a downtrend. The long-term moving averages on the chart, the 200-day, 100-day and 50-day averages are well above the market. The 50-day (green, 284.70) is the closest, with the 100-day (grey, 289.80) and 200-day (purple, 302.20) hovering way up there. However, the short-term moving averages on this chart, the 5- and 10-day, (blue/red, 277.50 and 276.90, respectively) made a bullish crossover with Monday’s trade. While the market hasn’t taken off to the upside, the 10-day has offered and held as support so far this week. Stochastics (bottom subgraph) are trading roughly mid-range and are pointing higher. We haven’t seen that indicator trade much above this level since the 27.50 mover higher in August. Looking back, this market has been much more willing to be oversold than overbought this year. Seasonally, Soymeal tends to rally during October, and you can scroll down to see the seasonal data (don’t take my word for it, go look!)
The market spiked to a low of 270.10 on October 1st, but closed that day positive (up 0.30). Following that, the market rallied on the 2nd, tried to on the 3rd but ran into what I think was profit taking last Friday. Since then, the market has traded sideways, basically, unable to close above last Friday’s close. It has not sold off this week.
Because of the 5- and 10-day moving average making a bullish crossover AND the seasonal tendency to rally, I think that aggressive and well-margined traders may do well to establish long positions in December Soymeal. I think your risk (Sell Stop order) should be just below the contract low, set October 1st, which is at 270.10. As I don’t know where you might enter, that’s a $690 risk from today’s close to the 270.00 level, before your commissions/fees. You make want to have it a touch lower than that depending on your risk tolerance and account size, and if you do, Soymeal is $10 a tick. For an upside target, the 100-day moving average is just shy of 290.00. From today’s settlement, that would be a potential gain of $1,310, less your commissions/fees. If you prefer a target near the August high, a move to 300.00 would result in a potential gain of $2,310 per contract, less commissions/fees.
Less aggressive traders and speculators may do well to consider the Call Options in December Soymeal. Those options expire on Nov 21st, giving you 43 days until expiration. A December 290 Call settled at 2.00 today, or $200 out-of-pocket, plus your commissions and fees. As they’re not terribly expensive, I would suggest buying them in an even number quantity (2, 10, 20 or whatever works for your account size and risk tolerance) The reason for that is that I would suggest you take off ½ of them when the market has rallied enough to give you 2x what you paid, plus your commissions/fees, and keep the rest with an eye toward exiting all of them should the December futures contract hit 300.00. You’ll have recouped all of your expense, while still leaving room for the market to go higher, assuming the market cooperates in a timely manner.
If you like what you’ve read here and would like to see more like this from Walsh Trading, please Click here and sign up for our daily futures market email.
Every morning, at about 8 AM CST, I post a short video highlighting where I see opportunities in the futures markets. You can view my most recent video here
(Weekly)
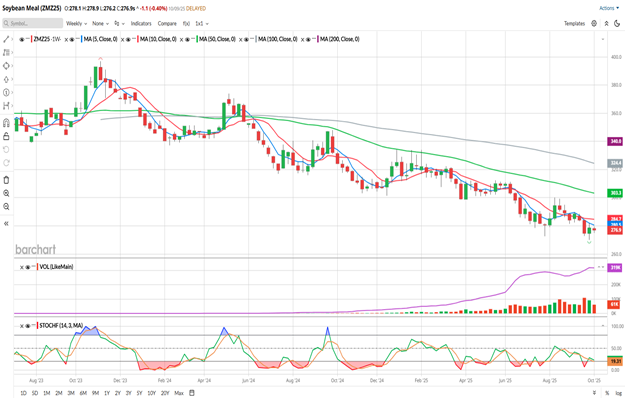
So far this week, December Soymeal is down 1.70 since last Friday. The weekly chart shows a market that has been trending lower for almost the whole view above, and certainly since it made the peak shown in October of 2023. I see lower lows and lower highs and a pretty solid downtrend. The short-term averages displayed above (5- and 10-week) made a bearish crossover 3 weeks (bars) ago and are both above the market offering potential resistance. The 50-week average (green, 303.30) hasn’t been interacted with since the first week in February and the 100-day (grey) was last touched in May of ’24. Both of those averages are declining and pointing lower. Weekly Stochcastics are just above oversold territory and also pointing lower. It’s going to take a significant move higher and a weekly close (or 2!) above that green moving average to really change the trend and turn this market decidedly bullish, in my opinion.
According to Barchart’s Seasonal Data, which you can find here, Soymeal has rallied during October 11 out of the past 15 years and 9 out of 15 years in November.
If you like what you’ve read here and would like to see more like this from Walsh Trading, please Click here and sign up for our daily futures market email.
Every morning, at about 8 AM CST, I post a short video highlighting where I see opportunities in the futures markets. You can view my most recent video here
Jefferson Fosse Walsh Trading
Direct 312 957 8248 Toll Free 800 556 9411
jfosse@walshtrading.com www.walshtrading.com
Walsh Trading, Inc. is registered as a Guaranteed Introducing Broker with the Commodity Futures Trading Commission and an NFA Member.
Futures and options trading involves substantial risk and is not suitable for all investors. Therefore, individuals should carefully consider their financial condition in deciding whether to trade. Option traders should be aware that the exercise of a long option will result in a futures position. The valuation of futures and options may fluctuate, and as a result, clients may lose more than their original investment. The information contained on this site is the opinion of the writer or was obtained from sources cited within the commentary. The impact on market prices due to seasonal or market cycles and current news events may already be reflected in market prices. PAST PERFORMANCE IS NOT NECESSARILY INDICATIVE OF FUTURE RESULTS. All information, communications, publications, and reports, including this specific material, used and distributed by Walsh Trading, Inc. (“WTI”) shall be construed as a solicitation for entering into a derivatives transaction. WTI does not distribute research reports, employ research analysts, or maintain a research department as defined in CFTC Regulation 1.71.